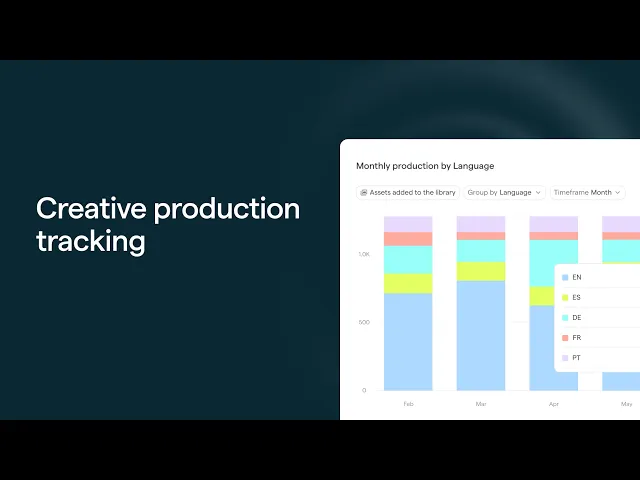
Creative production tracking: how to measure what your creative team actually ships
See how much creative your team actually shipped, broken down by type, style, and hook. How to track creative output without counting files in Drive.
It's the last Friday of the quarter. Your head of growth drops a message: "Quick question before we're out: how many creatives did we ship this quarter, and what was the split between video and static?"
You know the answer is in there somewhere. You start digging through Drive folders, the Monday board, the batch tracker editors update when they remember to, and ads that went live in Ads Manager. An hour later you've got a number you're 80% sure of with no real breakdown behind it. You send "roughly 240, mostly video" and hope nobody asks you to prove it.
Tracking output is something performance creative teams are directly accountable for. And for most teams, creative volume and related insights are some of the hardest numbers to actually track.
Creative production tracking closes this gap, and Focal is the only tool that does it cleanly. Cloud storage holds your files, project tools track your tasks, and analytics tools measure live ad performance. None of them can tell you how much your team actually produced and what the mix looked like. Focal can, so your production numbers are tracked in real time rather than a manual tally, broken down by category, format, style, hook, production partner, and more.
The number you're measured on is the one you can't see
Almost every creative team we work with has an output target. A set number of new assets, hooks, or concepts shipped per sprint or per month. One mobile gaming team put it plainly: their creative team has OKRs tied to how many assets they need to turn around, and they wanted a way to track that productivity over time (without building it by hand).
This is a major gap that no other software solves for in a clean way. You're held to volume targets one way or another, your designers and editors are working flat out to hit them, and at the end of the quarter the throughput is not analyzable in any meaningful way. Reporting means a manual asset total at best. It rarely gives any usable breakdowns, where the useful questions live.
What is our win rate? Out of all creatives we shipped this month, how many became winners? (for example: how many creatives were able to spend >$500 at our target CPA)
How many themes addressing major customer pain points did we ship per month this quarter?
How much of last sprint was UGC video versus static image ads?
Did the team actually produce more after we onboarded the new agency, or did it just feel busier?
How much ad material that actually goes live are we getting per dollar from our creative agencies and freelancers?
Is there any correlation between ad performance and who (e.g. a specific designer or agency) made the creative?
Creative production tracking answers those questions. It's the production-side counterpart to performance reporting: not how your live ads did, but how much your team made and what the mix looked like.
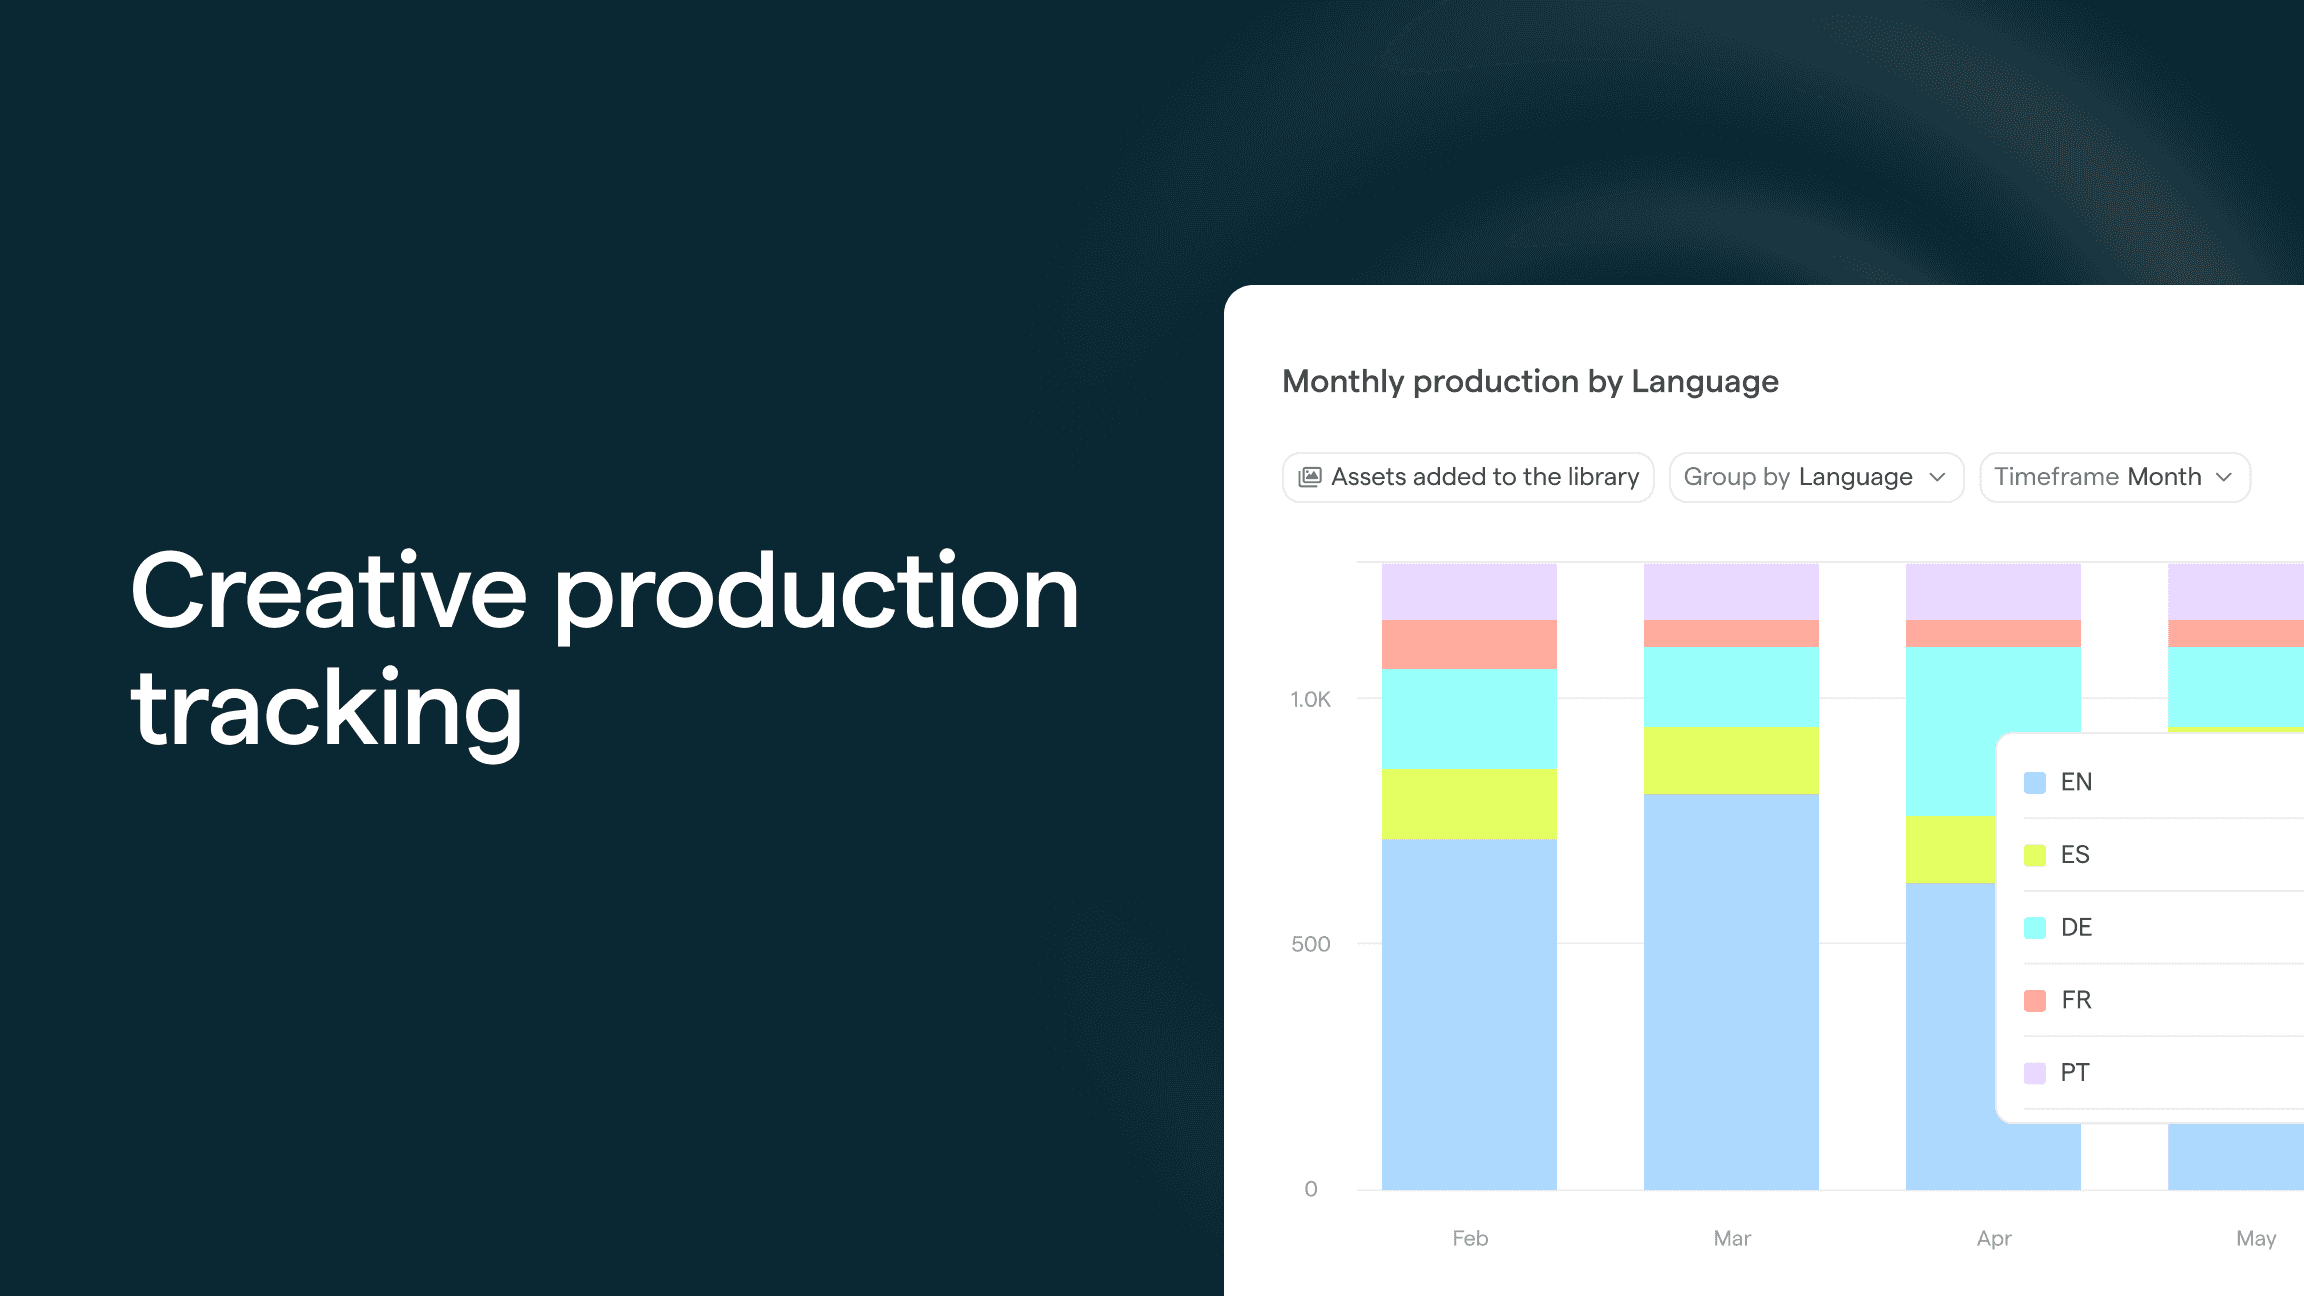
Example Focal production report: month-over-month creative volume by language
Why the tools you already have don't give you this
Most teams have something that feels like it should cover output tracking.
Google Drive and Dropbox are where the finished work lands, so they feel like the source of truth. But a folder is a pile of files, not a report. Counting is manual, the count is only as accurate as your folder discipline, and there's no way to slice the total by format, style, or hook without opening every file or building complex custom solutions.
Monday, Asana, and Jira track tasks and statuses, not shipped creatives. Task throughput doesn’t equal creative throughput. A closed ticket tells you a task is done. It doesn't tell you whether one asset shipped or twelve, or whether they were statics or 30-second cutdowns.
Spreadsheet batch trackers can work, but volume breaks them, and they typically lack granularity. They depend entirely on someone updating a row every time an asset ships and tell you very little about how long producing something actually took.
LLMs could be used to solve part of the problem, but by themselves they lack necessary context: what is done, what is a new version, what is a draft, when was production on a particular asset started and so on.
Creative analytics tools measure the wrong half. They tell you how the creatives that went live performed. It is also essential, but performance and production are different questions. Knowing your top hook had a ROAS of 3.5 tells you nothing about how many hooks your team tested to find it. Production data sits upstream of performance, and most reporting skips straight past it.
What creative production tracking should actually do
A production report should make output data a byproduct of the work, not a separate reporting chore. It should also help you and your team answer certain key questions.
1. Tracks output volume over any period
The base layer is a clean count of what shipped, viewable by week, sprint, month, or quarter. You should be able to open it the moment leadership asks and read the answer off the screen, not rebuild it in a spreadsheet.
2. Offers breakdowns by category, format, style, and hook
A total is a start. The mix is where the insight is. Splitting output by category, format, style, or production partner turns "we made 240 creatives" into "we made 240 creatives, 70% video, the batches from creative agencies cost us $10,000 in total and Creative Agency A’s concepts consistently outperformed Creative Agency B." That second sentence is something a Creative Strategist can act on. It tells you where the team is over-indexed, who is producing content that performs, and where the next brief should push.
3. Tells you how much work went into finished assets
While asset totals and breakdowns are useful, you can get a lot of additional insight from data around the production process. The number of versions or the amount of comments per asset can tell you how much iteration and back-and-forth it takes to get an asset from a brief to a live ad.
Let’s take a practical example: You work with two creative agencies, each charging you 10,000 dollars per month for a batch of ad creatives. Each agency delivers you the same number of creatives at the same direct cost. However, you can see the opportunity costs are drastically different.
Your Production Report shows that Agency A requires on average 3 versions of assets to get approval.
Agency B only requires a single revision every now and then.
The opportunity cost and time you spend on reviews with Agency B is much lower. Once you combine that with performance data, you can make much more educated decisions about what kind of material to produce with each partner, and if the way you brief them should change for example.
4. Is visible to the whole team
Output isn't only a leadership number. When designers and editors can see what the team shipped and in what mix, the target stops being an abstract OKR someone reports on once a quarter and becomes something the people doing the work can actually see themselves moving.
These are the things we built Production Reports to do. They read from the assets already in your Focal library, count what your team shipped over any period, and break it down by category, type, style, or hook, and other useful parameters using the tags Focal applies automatically. No manual counting or separate trackers to keep alive manually.
Why production visibility is worth the trouble
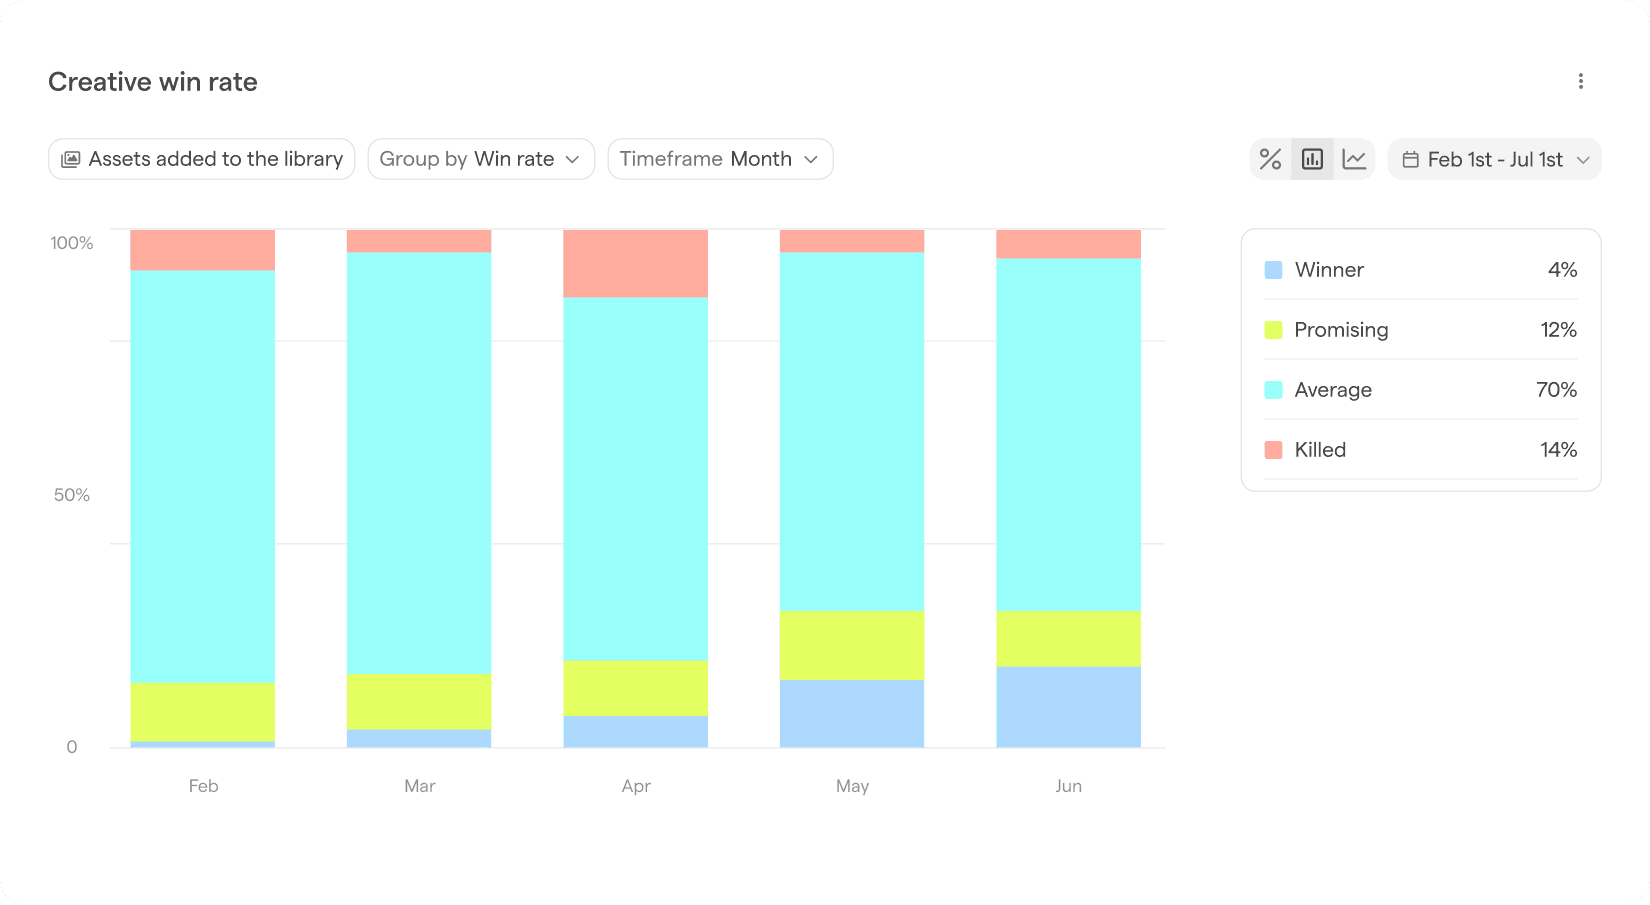
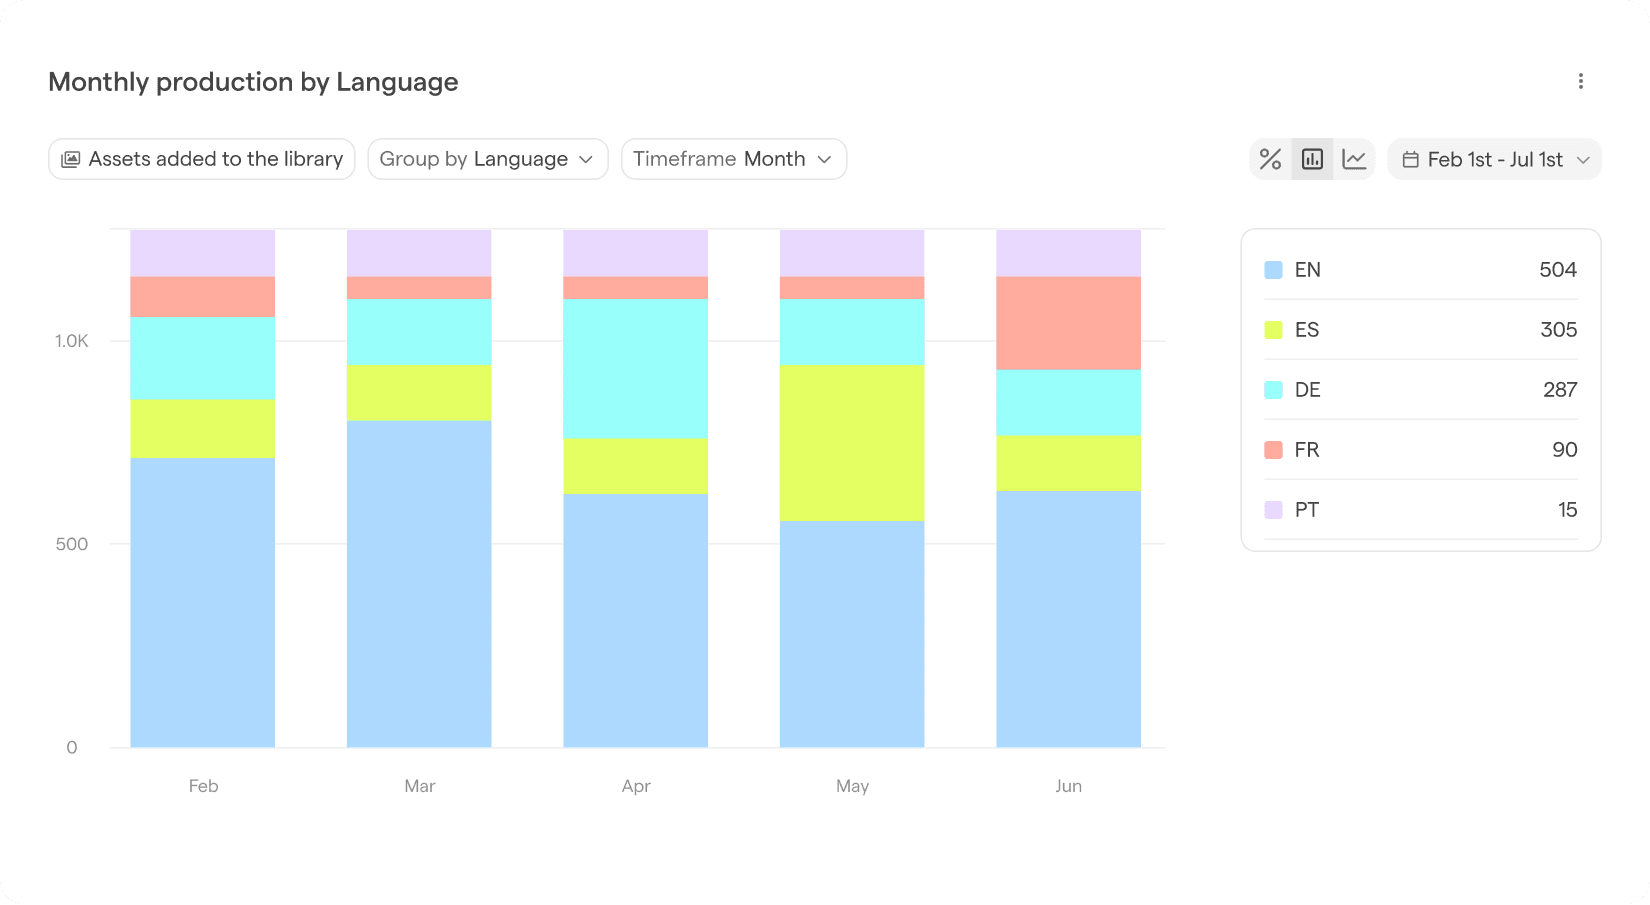
Example Focal production report: month-over-month creative win rate.
The teams that get the most out of this are the ones scaling production hardest, because that's where the numbers move fastest and matter most.
When you produce hundreds of ads per month or more, you can no longer hold the picture of what you produced in your head, and the cost of flying blind goes up exactly as the number gets more impressive.
We work with DTC, ecommerce, and app brands shipping 100+ new ads a month with small teams. At that scale counting folders doesn’t help you answer vital questions such as:
"How many creatives and concepts did we produce per month?”
“What was the mix asset mix?”
“How well does each asset perform versus how much time and money it takes to produce?"
You need a system to answer these questions in detail, and Focal now has those answers. It lets a small team keep pushing volume without losing the thread of what they're actually producing.
Once you can see what you shipped, the natural next question is what worked, and that's where creative insights connects performance data back to the same assets. Output on one side, performance on the other, both attached to the real files.
The teams that can see their output, manage it
A team that can read its production at a glance spots a format over-indexing before it becomes a rut, catches a sprint that underdelivered while there's still time to react, and can make the right call about how much to invest in specific types of creatives in the future in the time it takes to open a tab. A team piecing this information together manually from separate sources is guessing, every quarter, about the one number it's judged on.
Creative volume is a major lever in performance advertising. Guessing at how hard you're pulling it is a strange place to operate from. Production Reports turn that guess into numbers you can actually see and act on.
Want to see your team's output in one view? Get a demo.
FAQ
What is creative production tracking?
Creative production tracking is the practice of measuring how much creative your team produces over a given period, and breaking that output down by attributes like format, style, or hook type. It answers the question "how much did we make, and what was the mix?" It's distinct from creative performance analytics, which measures how the creatives that went live actually did. Production tracking sits upstream of performance: it's about throughput, not results.
How is a production report different from creative performance analytics?
A production report measures output: the volume of creative your team shipped and the breakdown of that volume by type. Creative performance analytics measures results: how the live creatives performed on metrics like ROAS, CTR, and spend. Both matter, and they answer different questions. You need production data to know whether your team is hitting its output targets, and performance data to know which of those creatives worked. Tools like Focal's Creative Insights handle the performance side; Production Reports handles the output side.
Can't I just track creative output in Monday or Asana?
Project management tools track tasks and statuses, not shipped creative. A closed task tells you work is done, but not how many finished assets resulted or what type they were. Output throughput and task throughput look similar but measure different things. A production report counts the actual assets your team delivered and lets you break them down by category, format, style, or hook, which a task board can't do.
How does Focal track creative output without manual counting?
Focal's Production Reports reads directly from the assets in your library. Because Focal already applies tags to assets automatically, the report can count what shipped over any period and break it down by category, type, style, or hook with no manual logging and no naming convention to maintain. The report is a live view of work that already happened, not a tracker someone has to keep updating.
What can you break creative output down by?
In Focal's Production Reports, you can view output volume over any period (week, sprint, month, or quarter) and break it down by category, format, style, or hook type. That lets you see not just how much your team produced, but the mix: how much video versus static, how many distinct hooks were tested, and where your production is concentrated or thin.

